This knowledge base article explains how items are categorised against ABC codes based on transactional history.
Below are the ABC Codes used in this article.
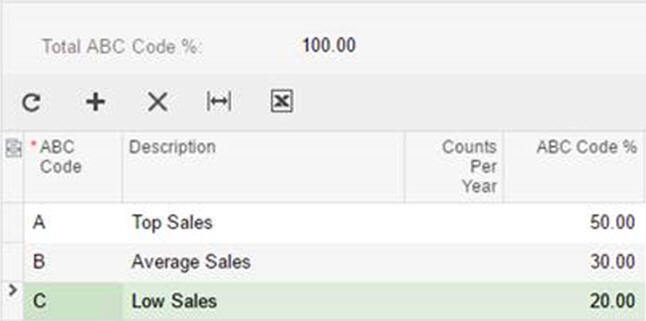
50% of the Stock is for high sales, 30% of the Stock is for medium sales and 20% stock is of rest of the sales.
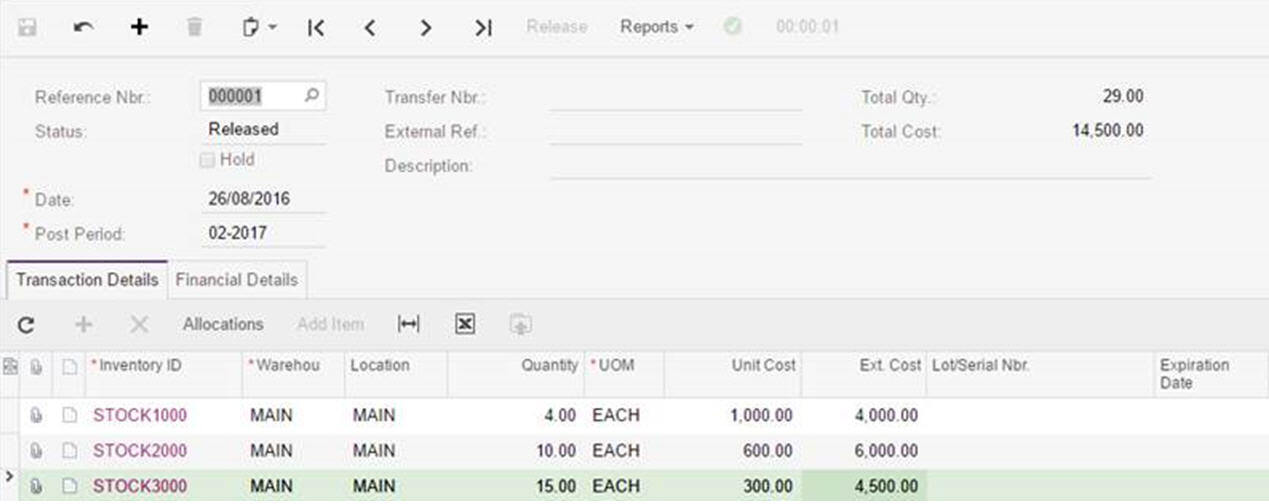
Below is an example of the data that will be used to base the ABC calculation
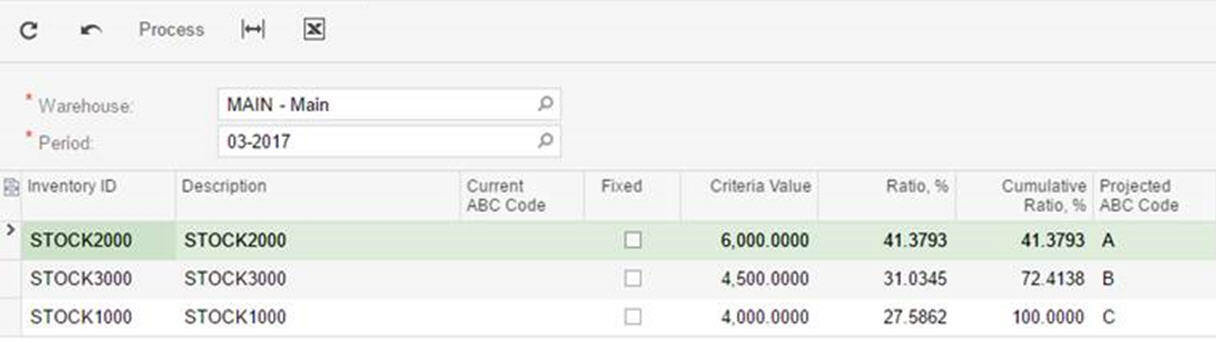
The projected ABC shows values as like below
- STOCK2000 has high ratio it is categorized as A
- STOCK3000 has medium ratio and categorized as B
- STOCK1000 has low ratio and categorized as C
Ratio Calculation:
Total Sales = 14000
Criteria Value = Current Stock Qty * Average Cost
Cumulative Ratio = Stock Ratio + Previous Ratio
Ratio for Stock1000 = 4000 / 14500 * 100 = 41.3793
Ratio for Stock2000 = 4500 / 14500 * 100 = 31.0345
Ratio for Stock3000 = 6000 / 14500 * 100 = 27.5862
Before processing
After processing
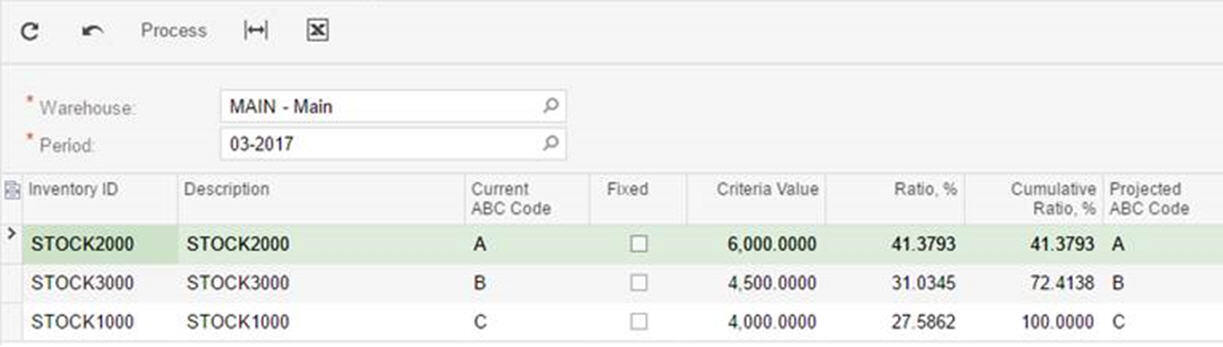
- Category A:
Items for which the subtotals are less than the threshold for the code A (STOCK2000 subtotal cumulative ratio of 41.3793 is less than 50% defined in the ABC Codes area) - Category B:
Items with subtotal percentages between the threshold for A (50%) and the sum of the threshold for A and B (50 % + 30% = 80%) codes will be assigned to the pending B Code. STOCK3000 has cumulative subtotal of 72.4138 which is between 50 and 80 and hence assigned to relevant ABC code. - Category C:
The cumulative ratio subtotal for the C- code items should be greater than the sum of A and B which is 80% and less than the cumulative of A+B+C which is (50+30+20) = 100% . The STOCK1000 cumulative ratio subtotal is less than equal to 100 and hence lying in category C .